
Blog
Appliance Repair KPIs: The Complete Guide for Business Owners
Understanding appliance repair KPIs is the difference between running your business and letting your business run you. As the owner of Appliance Marketing Pros, I’ve worked with dozens of appliance repair and HVAC business owners who want the same thing: more leads, more revenue, and more control over their operation. But one of the biggest blind spots I see is a lack of visibility into performance. They’re running without a dashboard.
If you can’t measure it, you can’t improve it.
That’s why I put together this breakdown of the most important appliance repair KPIs every company should track. These same metrics apply to HVAC businesses as well. These aren’t vanity metrics. These are real numbers that tell you whether your team is productive, your customers are happy, and your business is profitable.
The difference between struggling at 2-3% net profit and thriving at 15-20%+ comes down to systematically measuring what matters. Appliance repair and HVAC businesses that track the right KPIs achieve 15-30% efficiency improvements and 10-20% revenue increases within their first year of implementation. The technology exists today at accessible price points for businesses of all sizes, from solo operators running a single van to multi-technician operations serving entire metro areas.
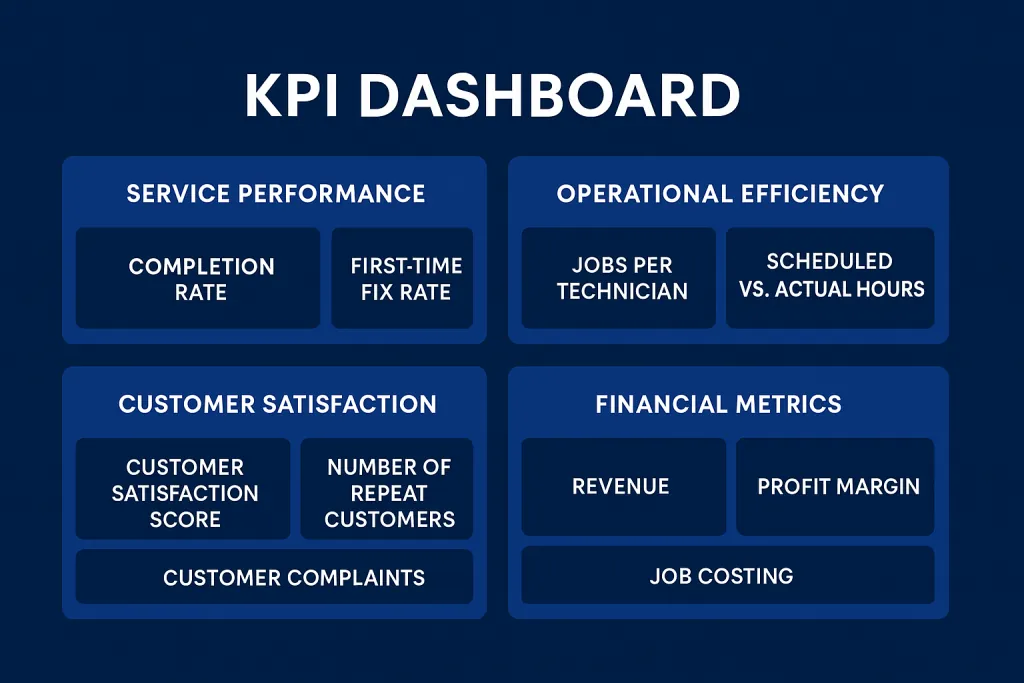
I’ve grouped these appliance repair KPIs into five categories, so you can track what matters most and build a dashboard that gives you a true pulse on your company. HVAC business owners will find these same KPIs equally valuable.
1. Field Operations KPIs: First-Time Fix Rate and Response Time
These operational appliance repair KPIs tell you how well your technicians are performing in the field and whether your operations are running smoothly.
First-Time Fix Rate (FTFR)
What it is: The percentage of jobs completed on the first visit without a return trip.
Why it matters: This is the single most important operational metric for any appliance repair business. High FTFR means happier customers, lower fuel costs, and fewer wasted technician hours. Each repeat visit requires an average of 1.6 additional trips to resolve the issue, consuming technician time that could generate new revenue. Best-in-class appliance repair companies achieve 85-90% first-time-fix rates, compared to the industry average of 75%. That difference translates to $200- $ 300 saved per avoided repeat visit. For a company completing 100 jobs per month, improving from average to excellent FTFR saves $20,000- $ 30,000 annually.
How to track it: Tag every completed job in your CRM as “first-time fix” or “repeat visit.” Review weekly and by technician. The primary culprits for low FTFR are insufficient parts inventory (responsible for 68% of service delays), inadequate technician training, and poor diagnostic processes. If your techs keep going back to the same jobs, dig into the root cause.
Average Response Time
What it is: Time from when the customer contacts you to when the tech arrives.
Why it matters: Faster response times lead to more jobs won, higher close rates, and stronger customer satisfaction. When someone’s refrigerator stops working, they’re not waiting around for days. They’re calling multiple companies and booking whoever can get there first. For emergency appliance service, the industry standard is same-day or next-day arrival. Best-in-class companies respond to urgent calls within 2-4 hours. Scheduled service requires arrival within 24-48 hours to remain competitive.
How to track it: Use your dispatch software timestamps to calculate average daily and weekly response times. Break this down by service type (emergency vs. scheduled) and by zip code to identify areas where you might need route optimization.
Job Completion Time
What it is: How long it takes a tech to complete a repair once on-site.
Why it matters: Shorter times (with quality intact) equals more jobs per day equals more revenue. The average appliance repair takes 1-2 hours, depending on complexity. Refrigerator repairs tend to take 1.5-2.5 hours, while smaller appliances like microwaves or garbage disposals can be completed in 30-60 minutes. Understanding these benchmarks helps you schedule more accurately and identify technicians who may need additional training.
How to track it: Log the technician’s start and end times for each job. Look for outliers and bottlenecks. If one tech consistently takes twice as long on washer repairs, that’s a coaching opportunity.
Technician Utilization Rate
What it is: The percentage of a tech’s workday spent on billable tasks.
Why it matters: This metric reveals how effectively you’re using your most expensive resource: technician labor. The target range is 70-75% billable hours against total available time. Anything below 65% indicates significant scheduling inefficiencies or insufficient job volume. High-performing operations achieve 75-80% utilization, though pushing beyond 85% risks technician burnout and quality degradation.
How to track it: Total billable hours divided by total paid hours per tech. Track weekly. Companies with low utilization often encounter problems with route optimization, excessive administrative burden, poor skill matching to jobs, or inadequate parts availability, leading to waiting times.
Schedule Adherence (On-Time Arrival Rate)
What it is: Percentage of jobs where techs arrive within the promised time window.
Why it matters: On-time performance directly affects customer satisfaction and online reviews. Nothing frustrates a customer more than taking time off work to wait for a technician who shows up late or not at all. This metric also impacts your ability to book jobs, because customers who’ve been burned before will ask about your on-time guarantee.
How to track it: Use your GPS or dispatch system to log actual arrival times. Compare to scheduled windows. Target 90%+ on-time arrival. If you’re consistently missing windows, look at whether you’re overbooking, underestimating drive times, or dealing with jobs that run longer than expected.
2. Customer KPIs: CSAT, Net Promoter Score, and Retention Rate
Among the most important appliance repair KPIs are those measuring customer satisfaction. These metrics tell you whether your customers are happy and whether they’ll come back or refer others.
Customer Satisfaction Score (CSAT)
What it is: A post-service rating (typically 1-5 stars) from your customer.
Why it matters: High CSAT equals happy customers, repeat business, and referrals. When using a 5-point scale, CSAT scores of 80%+ (including 4-and 5-star ratings as satisfied) indicate strong performance. The key drivers of high satisfaction in appliance repair are first-time fix rate, technician professionalism, response time, transparent pricing, and cleanliness during service. Customers notice when your tech puts down floor protection and cleans up after the job.
How to track it: Send automated follow-up surveys after each job via SMS or email. Use a tool like NiceJob, Broadly, or the survey features built into your field service management software. Review results weekly and by technician.
Net Promoter Score (NPS)
What it is: A 0-10 scale asking how likely a customer is to recommend you.
Why it matters: NPS correlates directly with referral growth and brand loyalty. Home services companies average 34-37 NPS, with top performers exceeding 50 and world-class operations reaching 70+. According to Bain & Company research, industry leaders typically score twice as well as their competitors. Industry organizations such as the United Appliance Servicers Association (UASA), Professional Service Association (PSA), and Service Alliance Group emphasize customer loyalty metrics as essential to sustainable growth. For appliance repair specifically, a high NPS often indicates that customers trust you enough to call back for their next breakdown rather than shopping around.
How to track it: Include an NPS question in your post-job survey. Segment results by job type, technician, and appliance category. Promoters (9-10) are your referral engine. Detractors (0-6) need immediate follow-up to understand what went wrong.
Customer Retention Rate
What it is: The percentage of customers who return for a second service within a set timeframe (typically 12-24 months).
Why it matters: It’s far cheaper to keep a customer than acquire a new one. The average household has 8-10 major appliances, and they all eventually break down. A customer who calls you for a dishwasher repair should think of you first when their dryer stops heating. Strong retention rates indicate trust and satisfaction. They also provide more predictable revenue.
How to track it: Use your CRM to track repeat service within 12-24 months. Set goals by appliance category. Some appliance repair companies implement maintenance agreements, service contracts, or “priority service” memberships to formalize retention and create recurring revenue. HVAC companies often follow guidelines from organizations such as ACCA (Air Conditioning Contractors of America) and ASHRAE to structure maintenance contracts that drive retention.
Referral Rate
What it is: The percentage of new customers who are past customers.
Why it matters: Word-of-mouth is your cheapest and most trusted marketing channel. Referral customers typically have higher conversion rates, larger average ticket sizes, and better lifetime value than those acquired through paid advertising. A healthy appliance repair business should see 20-30% of new customers coming from referrals.
How to track it: Ask new customers how they heard about you. Track this source in your booking system. Consider implementing a formal referral program that rewards customers for referring friends and family to you.
3. Marketing KPIs: Cost Per Lead, CAC, and Lead-to-Booking Rate
These appliance repair KPIs tell you whether your marketing dollars are working and whether your team is converting leads into paying customers. For HVAC companies, the same metrics apply.
Cost Per Lead (CPL)
What it is: Total ad spend divided by total leads generated.
Why it matters: Lower CPL equals more efficient marketing. For appliance repair businesses, CPL varies significantly by channel. Google Ads for appliance repair keywords typically run $25-75 per lead, depending on your market’s competition. Facebook Ads and local service ads can be lower at $15-40. Organic search and Google Business Profile optimization deliver the lowest CPL over time but require consistent effort.
How to track it: Use Google Ads conversion tracking and call tracking software. Match ad spend to leads generated by source. Track this monthly and compare trends over time.
Customer Acquisition Cost (CAC)
What it is: Total marketing plus sales cost divided by total new customers acquired.
Why it matters: CAC tells you how much it costs to buy a customer. This is different from CPL because not every lead becomes a customer. If you’re spending $50 per lead but only converting 40% of leads to booked jobs, your actual CAC is $125. Home services companies typically spend $150-400 per acquired customer, depending on market and service type.
How to track it: Combine ad spend, marketing tools, and any sales payroll. Divide by the number of new customers. The critical metric isn’t absolute CAC but the ratio to customer lifetime value. Maintain an LTV-to-CAC ratio of at least 3:1; 4:1 or higher indicates healthy economics.
Conversion Rate (Lead-to-Booking)
What it is: The percentage of leads that turn into booked jobs.
Why it matters: Low conversion means leads are being wasted. Every lead you paid for but didn’t convert is money down the drain. Strong appliance repair companies convert 50-70% of inbound calls to booked appointments. If you’re below 40%, there’s likely an issue with your phone handling, pricing transparency, or availability.
How to track it: Track all calls and web forms. Count how many became booked appointments. Listen to recorded calls to identify where the breakdown happens. Common issues include CSRs not asking for an appointment, quoting prices that scare customers off, or not being available when customers need service.
Revenue per Campaign
What it is: How much money each marketing channel or campaign brings in.
Why it matters: This metric lets you cut waste and double down on what works. You might discover that your Google Ads generate $50,000 in revenue while your newspaper ads generate $2,000. That information should drive your budget allocation.
How to track it: Tag leads in your CRM by source. Tie completed jobs back to their original marketing campaign. This requires discipline in your intake process, but the insights are worth it.
Return on Ad Spend (ROAS)
What it is: Revenue generated divided by ad spend.
Why it matters: ROAS greater than 3-4x means your ads are profitable. Target a minimum 4:1 ROAS ($4 revenue per $1 ad spend) for paid advertising channels. Strong marketing performance achieves 5:1 to 8:1 ROAS. Local SEO and organic search can deliver 10:1+ ROAS over time as your Google Business Profile and website rankings mature.
How to track it: Track booked jobs plus revenue from paid campaigns using conversion tracking and CRM tagging. Review monthly and make adjustments to underperforming campaigns.
4. Financial KPIs: Revenue Per Job, Profit Margin, and Labor Cost
Financial appliance repair KPIs tell you whether your pricing is right and whether your business is actually profitable. These numbers ultimately determine whether you’re building wealth or just staying busy.
Revenue per Job
What it is: Total revenue divided by the number of jobs.
Why it matters: Higher average tickets mean more income per service call. For appliance repair, the national average is roughly $ 275 per completed job, including diagnostic fees and repair. Refrigerator and freezer repairs average $200-350+, while smaller appliances like microwaves tend to be lower at $75-150+. Oven, range, and cooktop repairs typically fall in the $150-250+ range, and ice maker repairs average $150-200+. Understanding your revenue per job by appliance type helps you make smarter decisions about which services to promote and how to price.
How to track it: Pull from your invoicing system. Watch for seasonal trends or discounts that could drag it down. If your average ticket is declining, investigate whether technicians are under-selling, whether you’re attracting lower-value jobs, or whether competitive pressure is forcing price cuts. Consider whether flat-rate pricing might help stabilize your revenue per job compared to time-and-materials billing.
Job Profit Margin
What it is: (Revenue minus direct costs) divided by revenue.
Why it matters: This tells you if your pricing is profitable. Direct costs include technician labor for that specific job and the parts used. Appliance repair businesses should aim for a 45-55% gross profit margin on service work. Parts-heavy repairs may have lower margins (35-45%), while diagnostic-only calls should have higher margins (60-70%).
How to track it: Track labor time, parts cost, and revenue per job. Calculate the margin for each service category and appliance type. If refrigerator repairs are consistently unprofitable, you need to adjust pricing or improve efficiency.
Labor Cost Percentage
What it is: Tech payroll as a percentage of revenue.
Why it matters: If labor costs climb too high, profits disappear. Appliance repair businesses should maintain 25-35% of revenue as direct labor costs. Anything exceeding 40% threatens your ability to cover overhead and generate profit. The key is matching billable rates to actual labor costs and appropriately allocating overhead.
How to track it: Weekly or monthly payroll versus revenue. Watch for shifts when job volume drops. If you’re paying technicians the same but completing fewer jobs, your labor percentage spikes and profitability suffers.
Operating Expense Ratio
What it is: Total overhead expenses divided by revenue.
Why it matters: This shows how lean (or bloated) your operation is. Overhead includes rent, insurance, vehicles, software, marketing, administrative salaries, and everything else that isn’t a direct job cost. Healthy appliance repair businesses maintain an operating expense ratio of 25-35%, leaving room for profit after direct costs.
How to track it: Use your P&L statement. Monitor monthly trends. Look for areas to trim, such as fuel costs, insurance, software subscriptions you’re not using, or rent for space you don’t need.
Net Profit Margin
What it is: Bottom-line profit divided by total revenue.
Why it matters: This is the number that ultimately matters. Many appliance repair businesses struggle at 5-8% net profit. Well-run operations maintain 10-15%, and best-in-class companies achieve 15-20%+ net margins. Below 10% net profit, you’re vulnerable to any disruption. Above 15%, you can weather challenges, invest in growth, and pay yourself well.
How to track it: Review your P&L monthly. The path from 5% to 15% net margin typically involves pricing discipline, operational efficiency improvements, better job costing, and systematic expense management. All of these improvements are enabled by tracking the right metrics.
5. Technician KPIs: Revenue Per Tech, Callbacks, and Jobs Per Day
These appliance repair KPIs show how your team members are performing and where coaching is needed. HVAC business owners should track these same metrics for their technicians.
Revenue per Technician
What it is: Total revenue divided by the number of techs.
Why it matters: This is a benchmark of technician productivity. For appliance repair, productive technicians generate $150,000- $ 250,000 in annual revenue. Top performers who excel at diagnostics and customer communication can reach $300,000+. The variance isn’t accidental. It reflects training, efficiency, and the ability to identify additional repair needs during service calls.
How to track it: Use your job and invoice data. Monitor weekly or monthly by technician. Significant gaps between technicians indicate opportunities for coaching or potential performance issues.
Jobs per Technician per Day
What it is: Average number of completed jobs per tech per day.
Why it matters: More completed jobs mean more revenue opportunities. The typical appliance repair technician completes 4-6 jobs per day, depending on job complexity and drive time. If a tech is consistently completing only 2-3 jobs, investigate whether there’s a scheduling issue, a route inefficiency, or a time management issue.
How to track it: Track daily job counts per technician. Compare against your benchmark and look for patterns. Some variation is normal based on job type, but consistent underperformance needs attention.
Repeat Visit Rate (Callbacks)
What it is: Percentage of jobs that require a second visit.
Why it matters: High callback rates indicate bad diagnosis, poor parts stocking, or rushed jobs. Every callback costs you money in technician time, fuel, and customer goodwill. It also tanks your first-time fix rate. Target less than 15% callbacks, with best performers under 10%.
How to track it: Use your job management system. Flag jobs that reopen within 30 days. Review callbacks by technician and by appliance type to identify patterns.
Technician CSAT/NPS
What it is: Customer rating per technician.
Why it matters: This shows who’s delighting customers and who might need coaching. Some technicians are technically excellent but struggle with customer communication. Others are personable but take shortcuts on repairs. Individual CSAT scores reveal these differences and enable targeted coaching.
How to track it: Break down survey results by tech. Share wins publicly. Coach gaps privately. Consider tying a portion of compensation to customer satisfaction scores to align incentives.
Parts Attachment Rate
What it is: Percentage of jobs where parts are sold beyond the initial repair.
Why it matters: This indicates whether technicians are identifying and communicating additional value. A tech who notices a worn door gasket during a refrigerator repair and mentions it to the customer is creating revenue opportunity and providing genuine value. The goal isn’t aggressive upselling but professional identification of issues the customer should know about.
How to track it: Track parts revenue per job and per technician. Compare against benchmarks. Low attachment rates may indicate technicians who are rushing through jobs or uncomfortable with customer communication.
How to Build an Appliance Repair KPI Dashboard You Will Actually Use
Once you’ve identified the appliance repair KPIs that matter most to your business, the next step is building a dashboard that puts them all in one place.
Here’s how I recommend setting it up:
Use a field service management platform like Housecall Pro, Jobber, ServiceTitan, or Workiz that includes built-in reporting. For smaller operations, even Google Sheets or a tool like Databox can work.
Start with the top 1-2 KPIs from each category. Don’t overwhelm yourself at first. You can add more metrics as you master the basics.
Update tactical KPIs weekly (job counts, response times, conversion rates) and strategic KPIs monthly (profit margins, customer retention, marketing ROI).
Color-code metrics using green for on track, yellow for slipping, and red for needs attention. This makes it easy to spot problems at a glance.
Share the dashboard with your office manager, dispatcher, or lead tech. Make it visible. When the team knows the numbers, they take ownership of improving them.
The right software makes tracking dramatically easier. For appliance repair businesses with 1-5 technicians, Workiz (free for 2 users) or Jobber Core ($25-49/month) provide scheduling, invoicing, and basic reporting without extensive training requirements. Mid-sized operations with 6-20 technicians benefit from Housecall Pro ($59-149/month) or Jobber Growth with QuickBooks integration and technician scorecards. Larger operations need ServiceTitan or FieldEdge for advanced reporting, marketing attribution, and multi-location support.
The implementation process matters as much as software selection. Successful companies follow a structured 90-day rollout. Week 1-2 focuses on defining 5-7 core KPIs and scheduling vendor demos. Week 3 involves system configuration, data migration, and basic dashboard setup. Week 4 launches a pilot program with 2-3 technicians to identify issues before full deployment.
Common implementation mistakes devastate adoption rates. Tracking too many KPIs simultaneously overwhelms teams. Insufficient training sabotages user acceptance. Poor data quality undermines trust in the system. Companies that avoid these pitfalls and invest proper time in setup report 15% efficiency improvement by month 6 and 20-30% gains by month 12.
What Separates Top-Performing Appliance Repair Companies
The appliance repair and HVAC businesses I see thriving share common characteristics. They don’t just track appliance repair KPIs; they build decision-making frameworks around insights.
One powerful approach is tracking revenue per lead: total volume divided by total leads including canceled, sold, and lost. With a target of $400+ per lead for appliance repair, this single metric accounts for both conversion rate and average ticket size, directly connecting marketing investment to business outcomes.
Transparency matters enormously. The best-performing appliance repair companies share dashboards with their teams, explain how metrics connect to business success, and celebrate improvements together. This creates buy-in and accountability. Companies that hide numbers or use them punitively see resistance and gaming of metrics.
Culture and technology work together. Data enables fairness, recognition, and informed decision-making, but only within cultures treating employees as valued partners. Disengaged employees cost businesses significantly in lost productivity, while companies with strong culture see better customer retention and employee tenure.
Marketing sophistication separates growing companies from stagnant ones. Hyper-targeted campaigns based on equipment age, past service history, and neighborhood can generate significant revenue. Heat maps showing revenue generation by geography guide budget allocation. Dynamic call tracking reveals which campaigns produce profitable customers versus high-volume, low-value leads.
Where Appliance Repair Software and KPI Tracking Are Headed
The field service management software market is growing rapidly, driven by AI-powered automation and mobile-first tools. For appliance repair and HVAC businesses, this means increasingly sophisticated options at decreasing price points. Tracking appliance repair KPIs has never been easier or more affordable.
Predictive insights are becoming accessible even to smaller operations. Software can now identify patterns like “customers who had refrigerator repairs are likely to need dryer service within 18 months” and automate follow-up marketing accordingly.
Mobile-first operations are becoming standard. Technicians expect to manage their entire day from a smartphone app, including work order details, customer history, parts lookup, payment processing, and communication. Companies still relying on paper work orders or phone-based dispatch are falling behind.
Customer expectations continue rising. Online booking, real-time technician tracking, text updates, and digital payment options are moving from “nice to have” to expected. Your software stack needs to enable these experiences.
The path forward is clear: successful appliance repair and HVAC businesses track the right KPIs, use appropriate technology, and build cultures of continuous improvement. Mastering these appliance repair KPIs gives you the competitive advantage. Those who act now will be positioned for growth while competitors continue flying blind.
Get Help Tracking the Appliance Repair KPIs That Drive Profit
At Appliance Marketing Pros, we specialize in digital marketing for appliance repair and HVAC companies. From SEO and Google Ads to web design and Google Business Profile optimization, we help home service businesses generate more leads and grow revenue.
When you’re tracking the right appliance repair KPIs, you’ll have a clear picture of what’s working and where to invest your marketing dollars for maximum return.
Ready to grow your appliance repair or HVAC business? Book a strategy call with our team today.